Home

Corona Atlas & Referencing System

Explore Atlas

About the Project

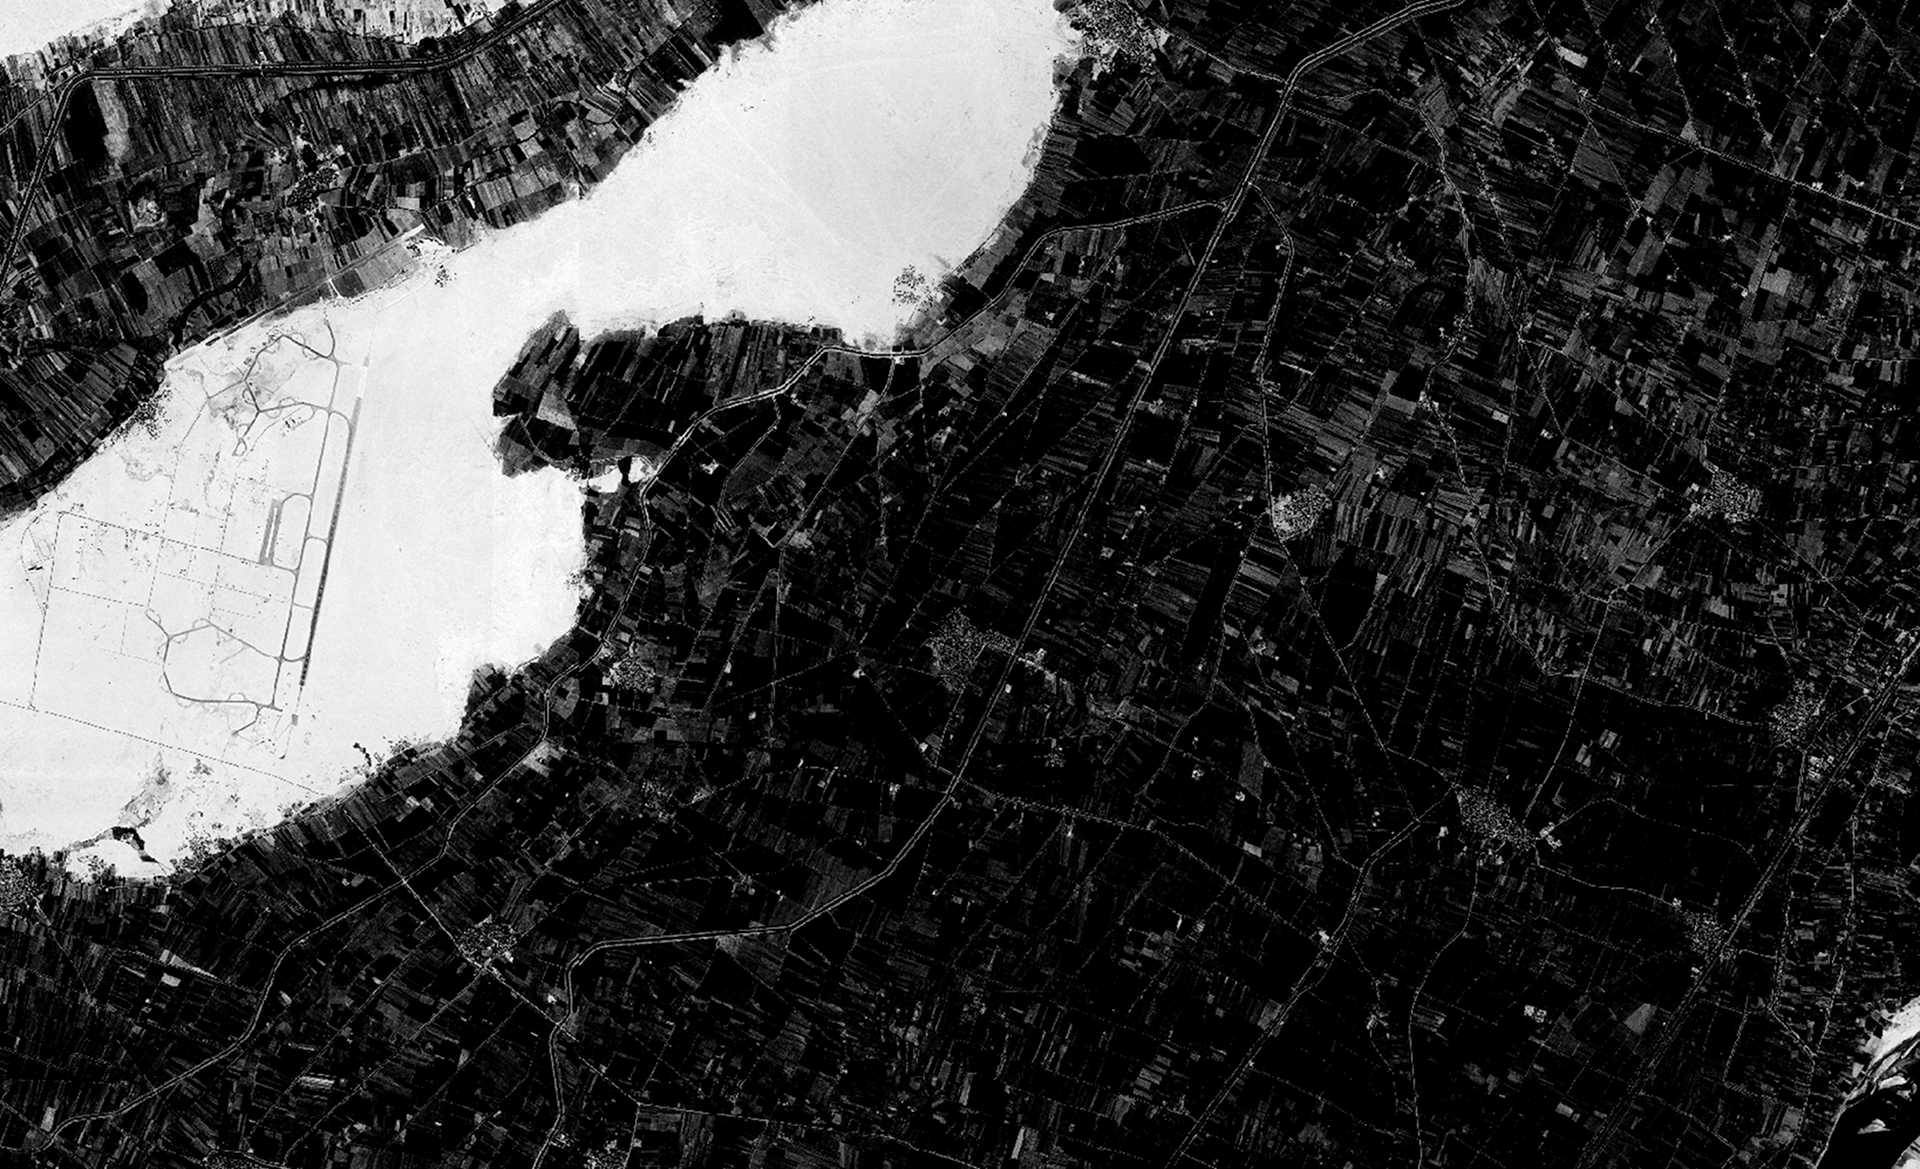
CORONA is the codename for the United States’ first photographic spy satellite mission, in operation from 1960-1972. During that time, CORONA satellites took high-resolution images of most of the earth’s surface, with particular emphasis on Soviet bloc countries and other political hotspots in order to monitor military sites and produce maps for the Department of Defense. The more than 800,000 images collected by the CORONA missions remained classified until 1995 when an executive order by President Bill Clinton made them publicly available through the US Geological Survey. Because CORONA images preserve a high-resolution picture of the world as it existed in the 1960s, they constitute a unique resource for researchers and scientists studying environmental change, agriculture, geomorphology, archaeology and other fields.

In regions like the Middle East, CORONA imagery is particularly important for archaeology because urban development, agricultural intensification, and reservoir construction over the past several decades have obscured or destroyed countless archaeological sites and other ancient features such as roads and canals. These sites are often clearly visible on CORONA imagery, enabling researchers to map sites that have been lost and to discover many that have never before been documented. However, the unique imaging geometry of the CORONA satellite cameras, which produced long, narrow film strips, makes correcting spatial distortions in the images very challenging and has therefore limited their use by researchers.

Thanks to grants from the National Endowment for the Humanities and the American Council of Learned Societies, the University of Arkansas’ Center for Advanced Spatial Technologies (CAST) has developed methods for efficient orthorectification of CORONA imagery and now provides free public access to our imagery database for non-commercial use. Images can be viewed online and full resolution images can be downloaded in NITF format.

IMAGERY

This project's initial focus was on the Middle East and surrounding regions, areas where CORONA coverage is abundant and where its value to archaeology and other fields has been well-demonstrated. The large majority of the images we provide come from the KH4B satellites, the latest generation of CORONA missions in operation from September 1967 through May 1972. During this time, there were sixteen successful CORONA missions, designated 1101 through 1117 which recovered more than 188000 images. These satellites were equipped with two panoramic cameras, one facing forward and another aft with a 30º angle of separation, producing an approximate ground resolution of 6 feet (1.8m) at nadir as well as offering the capability for stereo-viewing and the extraction of topographic data. Images were originally recorded on black-and-white film, copies of which are curated by the USGS EROS Data Center. The USGS has scanned the images at 7 micron (3600 dpi) resolution. Additional technical details regarding the CORONA program and image characteristics can be read here.

Cameras on different CORONA missions produced images that vary a great deal in quality, while many images suffer from cloud cover, atmospheric haze or other issues. For imagery which we purchased, we have concentrated on providing the greatest possible regional extent, as opposed to multiple images of the same area, and have also sought to offer stereo coverage wherever possible. Imagery purchased for this project has been supplemented by images purchased for other projects or those shared with us by colleagues, notably the Center for Archaeology of the Middle Eastern Landscape (CAMEL) and the University of Chicago’s Oriental Institute.

Our work has been largely dedicated to developing methods for orthorectification of CORONA imagery. The technical aspects of this process are described in a forthcoming paper: Jackson Cothren, Jesse Casana, Tuna Kalayci and Adam Barnes, “An efficient method for rigorous orthorectification of CORONA satellite imagery” International Journal of Remote Sensing.

Images from our database reproduced in publications, presentations or online should be credited to: Center for Advanced Spatial Technologies, University of Arkansas/U.S. Geological Survey
279
Corona Missions
2214
Corona Images
833
Archaeological Sites

Atlas Basics

Navigation

  • Zoom In to an area by double-clicking the mouse or holding the shift key while drawing a box.
  • Zoom In/Out using the mouse scroll wheel, or use the zoom controls in the upper right corner of the map.
  • Move/Pan around the map by holding the left mouse button while dragging.
  • Bookmarking is possible in the Atlas. Use browser capabilities for saving specific locations.

Visibility

At the default zoom level of the atlas, basic outlines representing the footprints for available CORONA images are displayed. As users zoom in to a larger scale, the CORONA images and archaeological sites become viewable.

Contents

Map layers can be toggled using the Map Contents menu. Some map layers are expandable, allowing sub-layers to be turned on or off. Use the plus sign(+) next to a layer to access sub-layers. Use the blue down-arrow next to an image to download the source data.

Check out the 2016 Corona Workshop

Atlas Layers

Missions

The Missions layer contains the areas covered by our collection of CORONA images. At lower scales, only mission footprints are shown to depict separate CORONA missions for easier viewing. Mission locations and coverage are estimated via photogrammetrical methods; they are representations of combined individual image footprints (bowtie shapes) mapped on the ground.

Corona Imagery

The Corona Imagery layer contains all Corona images available for viewing and download. For efficiency this layer is only active at or below a certain zoom level, and is therefore not viewable when the Atlas is initially opened. Images within the Corona map layer are organized by satellite revolution (or pass).

Sites

The Sites layer includes archaeological settlements in the Atlas. Locations and naming conventions are obtained from Oxford Encyclopedia of the Near East, Atlas of PreClassical Upper Mesopotamia (APUM) and ANE Placemarks for Google Earth of Uppsala University. By adhering to these conventions, we hope to maintain standardization in the site inventory, and overcome further confusion by adding secure ancient names of settlements, if available and when possible.

Credits

Archaeological Inventory Credits:

S. Anastasio, M. Lebeau, and M.Sauvage (eds.) 2004. Atlas of PreClassical Upper Mesopotamia (APUM), Brepols Publishers.

Eric M. Meyers (ed.) 1996. The Oxford Encyclopedia of Archaeology in the Near East, Oxford University Press.

Olof Pedersen. ANE Placemarks for Google Earth, Uppsala University http://www.lingfil.uu.se/staff/olof_pedersen/Google_Earth/ (last accessed November 01, 2011)

SRTM Credit:

Jarvis A., H.I. Reuter, A. Nelson, E. Guevara, 2008, Hole-filled seamless SRTM data V4, International Centre for Tropical Agriculture (CIAT), available from http://srtm.csi.cgiar.org (last accessed November 01, 2011)

Atlas Tools

Transparency Sliders    

The transparency sliders allow the user to adjust transparency for the CORONA imagery at the layer, mission, or individual image level. When the slider is on the left hand side, modern satellite imagery becomes more visible. As the slider moves to the right, the CORONA imagery becomes visually dominant.

Swipe Slider    

The swipe slider divides the area into two viewing parts, and enables user to view underlying layer without actually turning layers on and off. In this tool, the left view is dedicated to CORONA, and the right view is for the modern imagery. The user can swipe the images horizontally by clicking and dragging the slider handle at the bottom of the screen with the left mouse button.

Measurements

The measure tool allows for location, distance and area measurements. Two-dimensional measurement results appear in different selectable units next to the measure button. Resulting location measurement is reported in geographic coordinate systems in degrees, minutes, and seconds.

To measure a distance:   
  • Click the distance measurement tool.
  • Move cursor to the starting point, and left click.
  • Move the mouse cursor across the measured distance.
  • Double left click the mouse button if you want to end the measurement at the second point to create a line segment. Reported distance measurement is the length of that segment.
  • If measuring multiple line segments, once the next point is reached left click once to add another point (vertex) to mark the location. Continue until the last node, and double click to finalize the measurement. Reported distance measurement is the sum of individual line segments.
To measure an area:   
  • Click the area measurement tool.
  • Move cursor to the first point of the area, and left click.
  • Delineate the area by adding more points (vertices).
  • Double left click when the polygon defines the desired area.
To locate a point:   
  • Click the coordinate tool.
  • Move cursor to the interest point, and left click.
  • The location is marked with a small circle.

Corona Imagery

During the collection of Corona imagery, a number of satellites were successively launched and each launch was counted as a new Corona mission. During each mission, the imaging satellite orbited around the earth a number of times -- each orbit was considered a separate revolution. The mission number and revolution number for each image are recorded in the image name. For example, image DS1105-1009DA003 was captured during mission 1105-1 and revolution 009. The last four characters (A003) tell us it was the third aft image taken during that revolution. Image acquisition dates are also provided in parenthesis, located in the parent mission-revolution names tab.

Nearly all images obtained for this Atlas were capture by the KH-4B CORONA instrumentation. Due to the stereo camera design of the KH-4 satellites, most revolutions available within the Atlas contain both forward and aft -- nearly 100% overlapping images (during some missions, one camera failed to return usable images). Beyond this, some revolutions overlap one another resulting in multiple views for any given location.


Beyond overlapping fore and aft images, other forms of overlap exist and are important for the user to understand. The most basic of these is overlap between consecutive images (demonstrated by the red areas in the figure below). Another form of overlap results from revolutions overlapping one another (demonstrated by the blue areas in the figure below), resulting in multiple views for certain locations.


Due to the imaging geometry of CORONA, each image has a different, but compatible photogrammetric model. These models aim to reconstruct image-ground relations in the imaging sensor and are prone to variations as some of the physical camera parameters are not available. Therefore, spatial accuracy is not standard throughout the Atlas, and two CORONA images overlapping in an area may not perfectly match. In these cases selecting an image to download can be determined by visual inspection with the tools provided in the Atlas.


Using CORONA Images in Other Platforms

As an emerging standard, each National Imagery Transmission Format (NITF) file available for download contains one unprocessed CORONA image, along with a replacement sensor model (in the form of Rational Polynomial Coefficients - RPC) used to map the image to the ground. RPC information generated from inhouse control point measurements and software. Once fully downloaded, these images can be viewed in many Geographic Information Systems (GIS) software and remote sensing platforms. These images are not orthorectified, however, and require further processing. To help facilitate this process, we have prepared, and made available for download, SRTM DEM files for each Corona revolution HERE. Information on using ArcGIS to orthorectify the NITF files using the provided elevation data can be found HERE.

As one of the main advantages of NITF, with some additional processing users can geometrically refine images if they provide additional ground control points number in various off-the-shelf photogrammetric software.


Automated Processing and Alignment Errors

Not all images included in the atlas have been manually assessed for quality of alignment. Please contact us HERE if you discover any images that are considerably out of alignment with the underlying imagery. Sorry, we had to disable the error reporting form because of continued abuse by certain individuals.